


Returns have always been part of retail, yet 2026 is putting them under a brighter spotlight. As we advised in a Forbes article, “Returns are a $685 billion problem; but smart brands see opportunity.”
“Returns are devastating retailers. In 2024, it was estimated that returns amounted to over $685 billion in lost revenue in the U.S. alone. That’s not just a logistics problem; it’s a significant business challenge.
As the director of sales & strategic partnerships for a company that makes a popular e-commerce returns software solution, I often talk with e-commerce leaders. And one thing I’ve noticed is that some treat returns as an afterthought, something to handle only when it becomes unmanageable. But the most successful brands I’ve worked with view returns differently. They don’t just absorb the cost; they use returns to inform better decisions, boost customer retention and open new doors for growth.” Read Full Aricle on Forbes


Shipping costs aren’t getting friendlier, with USPS announcing an early 2026 rate increase of 5% and higher across their most popular Priority Mail and other product offerings. And customer expectations keep rising, and reverse logistics is now tied to brand trust as much as it’s tied to operations. If your team is feeling squeezed, you’re not alone. Industry forecasts and retailer reporting continue to point to rising return volume, even as more brands tighten policies and add guardrails.
At ReadyCloud, we see the pattern clearly: Returns aren’t only a warehouse problem. They touch conversion rate, customer lifetime value, support tickets, and even fraud exposure. Brands that treat returns as a core part of the customer journey tend to handle spikes with less chaos, and they also get better insights from the data those returns produce.

The State Of Ecommerce Returns In 2026
If you want one theme for 2026, it’s this: Return volume is rising faster than many teams planned for. Adobe Analytics reports that from November 1 through December 31, 2025, online shoppers in the U.S. spent $257.8 billion across retail websites. That total reflects a 6.8% jump compared to the same stretch the year before; which also means returns are spiking, too. That’s a meaningful difference, and it helps explain why teams can feel like they’re falling behind even in seasons where sales look solid.
At the same time, major industry bodies continue to publish benchmarks that confirm how large the returns economy has become. The National Retail Federation cited projected total retail returns in the hundreds of billions, to the tune of about $850 billion, plus online return rates that remain materially higher than overall retail.
“Your returns policy is actually one of the more influential pages on your website. Research from this UPS Survey finds that as many as 81% of consumers will read your return policy before making a purchase decision.” Read Full Article on Forbes


There’s also a policy tension in play. Stricter return policies are becoming more common, yet online return volumes are still expected to rise. EMarketer’s reporting captures that push and pull, with online return volume expected to grow even as policies get tighter and return fees become more common.
“E-commerce is as popular as ever before, and the return rates that come with it are growing fast. During the post-holiday period, these figures can spike. Vogue reported that, in December 2024–January 2025, consumers globally sent back $112 billion in merchandise—up 30% compared to the year before.
Every return eats into margins. There’s the cost of shipping, handling, restocking and, in many cases, refunding without recovery. Multiply that across tens of thousands of orders, and the impact is clear: Returns are no longer just an operational inconvenience but a vulnerability. The brands still relying on legacy systems, manual processes or disconnected teams will feel it first.” Read Full Article on Forbes
What The Best Operators Track (And Why It Matters)
A lot of brands track return rate and stop there. That’s a start, not a system. In 2026, the teams making progress tend to track returns like a performance channel, with inputs, outcomes, and segmented patterns. Returns data becomes far more useful when it’s tied to customer cohorts, product attributes, and operational timestamps.
| Metric | What to Review |
|---|---|
| Return Rate | Track return rate by category and SKU family to spot product-level patterns and shifts in performance. |
| Return Reasons | Review return reasons using standardized reason codes so trends stay consistent, clear, and easy to compare over time. |
| Exchange and Store Credit Rate | Measure exchange rate alongside store credit selection rate to understand how often value is retained instead of refunded. |
| Time to Resolution | Monitor the time from return initiation to final refund completion or exchange shipment. |
| Cost per Return | Calculate total cost per return, including shipping, labor, processing, and any loss in item value. |
| Warehouse Cycle Time | Track warehouse cycle time from item receipt through final disposition. |
| Support Contacts per Return | Measure how many customer support interactions are tied to each return to identify friction in the process. |
| Fraud Indicators | Watch for fraud signals such as high-frequency returners and unusual item-condition patterns. |
Once you have these, the next step is segmentation. A first-time shopper returning a low-cost item is not the same scenario as a high-value, long-term customer with a rare return. In 2026, leading brands are increasingly treating returns as part of loyalty and retention, not a one-size-fits-all process.
What’s Driving Higher Return Pressure Right Now
There isn’t one single cause behind rising return pressure. It’s a stack of behaviors, expectations, and operational realities that keep compounding. Some of these factors increase return volume directly, while others increase the cost and complexity of handling each return.
Common drivers we’re seeing in 2026 include:
- Provisional purchasing, where shoppers order with the expectation that at least one item will go back
- Bracketing, especially in apparel and footwear, where shoppers buy multiple sizes or styles and return most of them
- Higher expectations for speed and self-service, including real-time updates and fast resolutions
- Rising fraud and abuse pressures are forcing brands to add checks while trying not to annoy good customers
- Product page mismatch, where photos, descriptions, or sizing guidance don’t match what arrives
- Damage in transit, packaging issues, or fulfillment errors that result in unnecessary returns.
Even policy tightening can create second-order effects. Return fees and shorter windows can reduce certain kinds of returns, yet they can also increase cart abandonment or push shoppers toward competitors with more lenient policies. EMarketer highlights this risk, including consumer sensitivity to return fees.

The Real Cost Of Returns (And Why “Refund Amount” Is Only The Start)
The refund is the most visible part of a return, and it’s rarely the full story. The true cost includes shipping labels, labor, receiving, inspection, restocking, repackaging, and the very real loss in product value when an item can’t go right back into sellable inventory. On top of that, returns can trigger customer support contacts, adding expense and slowing teams down during peak weeks, adding more WISMO (where is my order) tickets to the que than expected and creating unnecessary friction and bottlenecks for teams.
The reality is that poor return experiences can cost far more than a single refund; they can also harm repeat-purchase behavior and brand perception. Once you’ve got that baseline, your ROI math for prevention gets much easier. A small reduction in avoidable returns can be worth far more than it looks on paper.
| Cost Component | What to Include |
|---|---|
| Shipping Costs | Account for both outbound recovery and inbound return shipping movement tied to each return. |
| Processing Labor | Include labor tied to receiving, inspecting, grading, and restocking returned items. |
| Value Loss | Factor in markdowns, refurbishment costs, disposal, and liquidation impact on product value. |
| Support Overhead | Capture costs from support tickets, chats, calls, and refund status inquiries tied to returns. |
“A great e-commerce experience requires more than competitive prices, a robust selection of goods, fast shipping and easy returns … it takes them all. Today’s consumer mindset has changed. Services like Amazon Prime have set the bar at a higher level, with speedy delivery, low prices, a vast selection and hassle-free returns.” Read Full Article on Forbes
Policy Design In 2026: Protect Margin Without Breaking Trust
The return policy is both a sales asset and an operational control point. That’s why tightening or restricting your policy isn’t automatically the right answer. A policy can reduce abuse while still staying customer-friendly, yet it takes clarity, consistency, and smart options like exchanges and store credit.
Industry data continues to reinforce that shoppers read return policies before purchasing, and free returns remain a meaningful factor in decision-making. NRF has repeatedly highlighted the importance of free returns to many shoppers.
| Policy Lever | What It Means |
|---|---|
| Clear Eligibility Rules | Define condition requirements, final sale rules, and category-specific exceptions so shoppers know what qualifies. |
| Window Length by Product Type | Set return windows based on product type instead of using one blanket timeframe for every item. |
| Exchange-First Paths | Make it easy for customers to swap sizes or variants before defaulting to a refund. |
| Store Credit Incentives | Encourage store credit options that help keep revenue within your ecosystem. |
| Transparent Fees | Keep fees clear and predictable so customers are not surprised at the end of the return flow. |
| Fraud-Aware Guardrails | Use customer segmentation and repeat-abuser limits to reduce fraud while keeping the policy fair. |
The key is messaging: If your customer learns about fees, exclusions, or strict condition rules after they’ve already initiated a return, it creates friction and increases support contacts. If those details are clear before purchase and are repeated in the return portal, shoppers feel informed rather than trapped.
“Your returns process is one of the most important aspects of conversion rate optimization (CRO) outside of the actual conversion itself. This is because the vast majority of consumers want to know that once they click the “buy” button, they’ll have a method of sending back any purchases that don’t work out. Given that research indicates that a mere 22% of consumers were satisfied with the ease of a recent return experience, ensuring that yours is fully optimized for success is critical.” Read Full Article on Forbes
Prevention Beats Processing: Practical Ways To Reduce Avoidable Returns
Most ecommerce teams can’t process their way out of a return problem. Prevention is where the margin wins live, especially for categories with high bracketing or expectation mismatch. Some improvements take time, yet many are quick operational and merchandising fixes that compound over a quarter.
| Prevention Move | Why It Matters |
|---|---|
| Upgrade Product Pages | Improve product pages with clearer sizing guidance, fit notes, and comparison details so shoppers can make more confident purchase decisions. |
| Add More Contextual Images | Use additional images that show scale, texture, and real-world context to set more accurate expectations before checkout. |
| Use UGC and Reviews Strategically | Position user-generated content and reviews as expectation-setting tools before purchase, not only as social proof. |
| Clarify Product Details | Spell out materials, care instructions, and what is included so buyers are not left guessing. |
| Reduce Fulfillment Errors | Use scan-based verification and stronger pick-pack standards to cut down on fulfillment mistakes. |
| Improve Packaging | Strengthen packaging to reduce damage-related returns and arrived-broken claims. |
A simple weekly habit can drive real progress: pick your top return reason and fix one root cause. If “didn’t match description” is trending, it’s often a product page content issue. If “too small” is trending, the sizing chart or fit content needs work. If “damaged” spikes, packaging, and carrier handling deserve a hard look.
Return reasons also help marketing. If a certain campaign drives high return rates, that can be a messaging mismatch, not a product problem. When return data connects back to channel and creative, you can cut waste and keep the customers who actually fit your brand.
Returns Software Is Infrastructure In 2026
Manual returns might work for a small volume, yet they break fast during peak. Spreadsheets, disconnected shipping labels, and one-off support emails often lead to slow refunds, limited visibility, and operational bottlenecks.
Purpose-built returns software changes the shape of the work. This is why growing retailers are shifting toward dedicated platforms that improve efficiency, protect margins, and deliver a better experience for shoppers and internal teams.
| Capability | Why It Matters |
|---|---|
| Branded Self-Service Returns Portal | Give customers a branded self-service portal so they can start and manage returns without needing to contact support. |
| Automated Label Generation and Routing | Use automated label creation and routing rules based on item type and condition to streamline return handling. |
| Exchange and Store Credit Flows | Support exchange and store credit options that reduce refund-only outcomes and help retain revenue. |
| Return Status Updates | Provide return status updates that cut down on “where’s my refund” support contacts. |
| Configurable Policy Rules | Use configurable policy rules that reflect actual business needs instead of forcing a one-size-fits-all process. |
| Connected Reporting | Tie return reasons back to products, customers, and time periods so reporting leads to better decisions. |
The right returns software also helps you scale without sacrificing the customer experience. That balance matters more than ever because shoppers expect fast resolution and clear communication, even when something goes wrong.
Turn Returns Into Revenue Intelligence
Returns generate signals your business can use to make smarter decisions. If you capture structured return reasons, condition notes, and SKU-level patterns, you can identify which problems are fixable and which are simply category norms you need to plan for.
| Revenue Intelligence Move | How It Helps |
|---|---|
| Capture Structured Return Data | Track standardized return reasons, condition notes, and SKU-level patterns so you can separate fixable issues from normal category behavior. |
| Improve High-Return Product Pages | Use return insights to upgrade sizing guidance, imagery, and descriptions on product pages with above-average return activity. |
| Catch Manufacturing and QA Issues Early | Identify recurring defects or quality problems before poor-performing batches drive a larger wave of returns. |
| Spot Carrier Damage Patterns | Connect damage-related returns to specific packaging methods or warehouse workflows so you can address the root cause faster. |
| Trigger Post-Exchange Win-Back Flows | Follow successful exchanges with win-back messaging to strengthen loyalty and build on a positive recovery experience. |
| Refine Purchasing Decisions | Use SKU-level return outcomes to adjust buying decisions for products that repeatedly create costly return scenarios. |
Segmentation is part of this, too. A strong returns strategy treats great customers with care while adding smart guardrails to prevent repeat abuse. The goal isn’t to make returns painful. The goal is to keep the experience smooth for legitimate shoppers while protecting the business from the patterns that crush margin.
Massive Returns Statistics For 2026 (Each Stat Includes A Source)
- Online return volumes are expected to rise 6.3% in 2026 to nearly $379 billion. (EMarketer).
- Online return volumes grew 5.7% in the prior year referenced in the same forecast, setting up an acceleration in 2026 growth. (EMarketer).
- Shoppers may abandon a retailer that charges return fees, with one survey cited at 59%. (EMarketer, citing FedEx survey).
- Total returns for the retail industry are projected to reach $849.9 billion in 2025, showing the scale sellers are carrying into 2026 planning. (NRF and Happy Returns).
- Retailers estimated 15.8% of annual sales would be returned in 2025, a benchmark many teams use as a planning baseline for 2026 capacity. (NRF and Happy Returns).
- An estimated 19.3% of online sales will be returned in 2025, reinforcing that ecommerce return rates tend to run higher than overall retail. (NRF and Happy Returns).
- 82% of consumers say free returns are an important consideration when shopping online. (NRF and Happy Returns).
- Return fraud remains a serious issue, with 9% of all returns classified as fraudulent in one major report. (NRF and Happy Returns).
- Nearly half of shoppers, at 45%, said it’s acceptable to “bend the rules” when returning items, according to the NRF and Happy Returns research. (NRF and Happy Returns).
- Total merchandise returns reached $685 billion in 2024, representing 13.21% of total retail sales in that year’s analysis. (Appriss Retail and Deloitte, via Business Wire).
- In the same analysis, fraudulent returns and claims were reported at $103 billion in 2024. (Appriss Retail and Deloitte, via Business Wire).
- Holiday order volume increased about 6% year over year in Retail Dive’s reporting, setting the context for return growth comparisons entering 2026. (Retail Dive, via PR Newswire distribution).
- Return volume rose roughly 11% in that same Retail Dive data, nearly twice as fast as holiday sales growth. (Retail Dive, via PR Newswire distribution).
- Retail Dive’s State of Post-Purchase 2025 report referenced a national survey of 3,461 U.S. online shoppers in August 2025 to measure post-purchase expectations. (Retail Dive).
- In that report summary, shoppers wanted acknowledgement, clear explanations, and real-time updates before they had to ask, each cited at 46%, 46%, and 45%. (Retail Dive).
- Retail Dive’s survey summary noted that 40% of consumers abandoned carts due to theft risk, linking post-purchase anxiety to conversion behavior and its connection to return expectations. (Retail Dive)
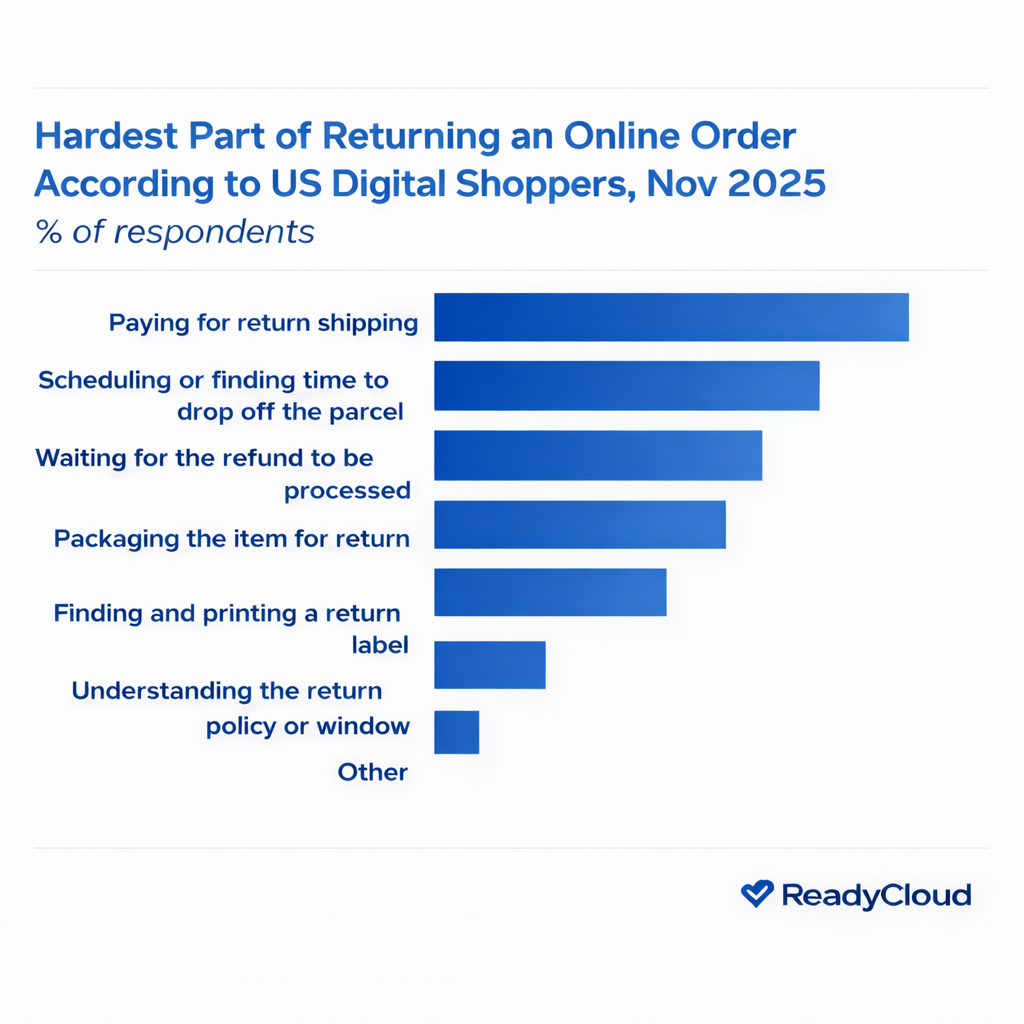
- 25% more retailers charged for return shipping in 2024, reflecting a policy-tightening trend that continues to influence 2026. (Retail Dive)
- Retail Dive also reported that many retailers shortened return windows, especially those longer than 30 days. (Retail Dive)
- Returns are a $685 billion problem in the U.S., aligning with broader estimates of return value for 2024 and explaining why brands are investing in returns strategies. (Forbes)
- 96% of shoppers read a return policy before buying, tying policy clarity to conversion. (Forbes)
- Post-holiday returns are a systemic issue that many retailers aren’t equipped with the technology and processes needed. (Forbes)
- Retailers are shifting toward purpose-built returns software to improve efficiency, protect margins, and enhance the experience. (ReadyCloud)
- That ReadyCloud resource also emphasizes that customers expect easy, quick returns and that friction can become a dealbreaker. (ReadyCloud)
- Vogue reported that a bad return experience can reduce future shopping intent, citing a Salesforce statistic showing a 93% likelihood of not shopping after a bad return experience. (Vogue)
What To Do Next: A 2026 Returns Readiness Check
If your team wants to improve return performance this year, start with three actions: measure accurately, reduce avoidable returns, and systematize the process so peak season doesn’t break you.
The brands that win in 2026 won’t be the ones that simply process faster. They’ll be the ones that prevent what they can, guide customers toward exchanges and credit where it makes sense, and keep the experience transparent from start to finish.
Here’s a simple readiness checklist you can run this week:
- Confirm your true return rate and cost per return, not only a rough guess.
- Identify your top 10 SKUs by return volume and the top 5 reasons driving them.
- Review your policy for clarity, consistency, and exchange-first pathways.
- Evaluate whether your current workflow can handle a 10% to 15% spike in return volume.
- Make sure customers can self-serve and see status updates without contacting support.
If you want help pressure-testing your setup, talk with our team. We’ll review your return flow, identify where friction and cost pile up, and map practical steps that fit your category and volume.
The Future of Ecommerce is Now
Staying ahead in the ecommerce industry means embracing innovation and anticipating changes before they arrive. The ecommerce trends shaping 2025 and beyond provide valuable insights into what’s next, but the future also brings exciting new possibilities. Businesses that adapt quickly and leverage the right tools will thrive in this dynamic landscape.
Ready for 2026? ReadyCloud Has You Covered!
Success in 2026 starts with the right tools, and ReadyCloud’s suite of solutions is designed to propel your ecommerce business to new heights. With ReadyCloud, you’ll have all your data centralized in one place, offering insights that drive smarter decisions. Take your marketing to the next level with Action Alerts, delivering growth-focused, automated campaigns that keep your customers engaged.

Shipping is easier than ever with ReadyShipper X, a multicarrier solution that simplifies your fulfillment process while saving time and money.

And when it comes to returns, ReadyReturns streamlines the entire process with an automated solution that boosts customer satisfaction and loyalty.

ReadyCloud is more than just a suite of systems—it’s your ticket to thriving in 2025 and beyond!
Start your journey to success today! Learn more and get started here.
Or contact our Sales Department at: 877-818-7447 ext. 1.
Frequently Asked Questions About Ecommerce Product Returns Statistics For 2026
What Is A Typical Ecommerce Return Rate In 2026?
Return rate varies a lot by category, price point, and product clarity, so there isn’t one universal number that fits every store. Industry benchmarks still show ecommerce return rates higher than overall retail, with widely cited research estimating online return rates in the high teens in recent reports. Use benchmarks as a reference point, then focus on your own baselines by category and SKU family. Once you’ve got that segmentation, you can see where prevention work will pay off fastest.
How Big Is The Ecommerce Returns Market In 2026?
Market sizing depends on whether a source is measuring ecommerce only or broader retail, yet the direction is clear. EMarketer expects online return volumes to rise to nearly $379 billion in 2026, underscoring how large the reverse logistics workload has become. That number also underscores why return policies and processing speed can influence margins in meaningful ways. For most sellers, planning for returns is now a core operating requirement, not a side task.
What Are The Most Common Reasons Customers Return Products?
The most common reasons tend to be fit issues, expectation mismatch, damage in transit, and fulfillment errors. Fit and sizing issues often drive apparel and footwear returns, while expectation mismatches can arise when product pages don’t provide clear visuals or specifications. Damage often returns and traces back to packaging choices or carrier handling patterns. Capturing structured return reasons inside your return flow is the fastest way to stop guessing and start fixing root causes.
Do Stricter Return Policies Actually Reduce Returns?
Stricter policies can reduce certain types of abuse and can discourage casual returns, yet they can also create friction that harms conversion and retention. EMarketer’s reporting highlights the risk that shoppers may abandon retailers that charge return fees, so policy changes need to be tested carefully. A better goal is a policy that’s clear, fair, and aligned with your category, plus a return experience that guides customers into exchanges and credit options when appropriate. Clarity and consistency usually beat surprise restrictions in the long run.
How Much Return Fraud Should Sellers Plan For In 2026?
Fraud exposure depends on category and customer base, yet major research continues to show that fraud is a real percentage of return volume, not a rare edge case. NRF and Happy Returns research has found that 9% of all returns are fraudulent, which is enough to justify guardrails and smarter review rules. The key is to segment your response so you don’t punish good customers for the actions of bad actors. Rule-based checks, customer history, and anomaly detection all help reduce losses without making returns miserable.
What Is Bracketing And Why Does It Increase Returns?
Bracketing is the behavior where a shopper buys multiple variants, often sizes or colors, with the intent to return the ones that don’t work. It increases return volume and processing costs, and it can distort your demand planning if you only look at gross sales. Better sizing guidance, fit content, and on-page education can reduce bracketing pressure, especially for apparel and footwear. Clearer product information also reduces “ordered to compare” behavior because shoppers feel more confident in their choice.
How Can Exchanges Reduce Refund Losses?
Exchanges can keep revenue in your business and can also improve customer satisfaction when the issue is fit, size, or preference. Many shoppers don’t want the experience to end in a refund; they want the right item with minimal hassle. Exchange-first flows work best when they’re fast, self-serve, and supported with clear inventory visibility so customers don’t hit dead ends. Over time, a strong exchange experience can turn a return moment into a loyalty moment.
What Metrics Should I Track To Improve Return Performance?
Return rate is only the first layer. Track return reasons, exchange rate, store credit selection rate, time to resolution, cost per return, and warehouse cycle time from receipt to disposition. Add customer support contacts per return so you can see how much friction is generating tickets. Segment these metrics by product category, SKU family, and customer cohort to find the patterns that matter. That combination of visibility and segmentation is where great improvements usually start.
What Tools Help Manage Returns At Scale In 2026?
Returns software has become infrastructure for many ecommerce teams because it reduces manual steps and increases visibility. A strong setup usually includes a branded self-service portal, automated label creation, routing rules, exchange and credit options, and reporting that ties return reasons back to products and customer cohorts. It should also keep customers informed of updates so support doesn’t get buried in refund-status questions.