
Estimates by think tanks like Statista place monthly active users at 600 million as of 2016 (a number that has assuredly increased since that time). Instagram daily active users peak at around 20 million daily, on average.
So what’s going on with this social channel this year? We’ll deliver a cadre of 2017 Instagram statistics to help keep you in the know.
Instagram Growth Statistics
Instagram’s usage has dramatically increased since 2013, when there were only an estimated 90 million active monthly users. Feeding the popularity of this site is the fact that it has earmarked a niche in becoming the most widely used social media platform by teenagers, with half of its users falling being between 18 and 24 years of age. It’s also become a central hub for luxury brands to showcase their goods, with think tanks estimating that approximately 67% of luxury brands maintain an active presence.
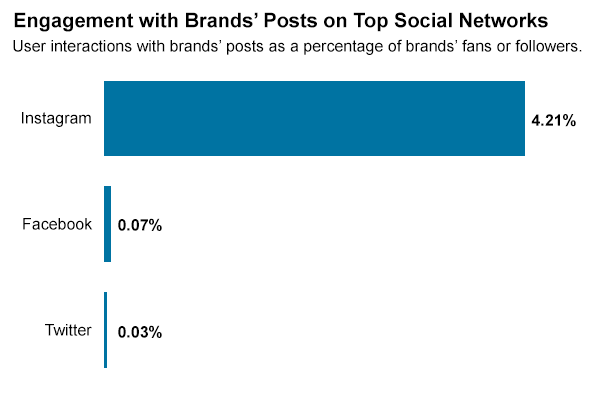
Instagram Performance Statistics
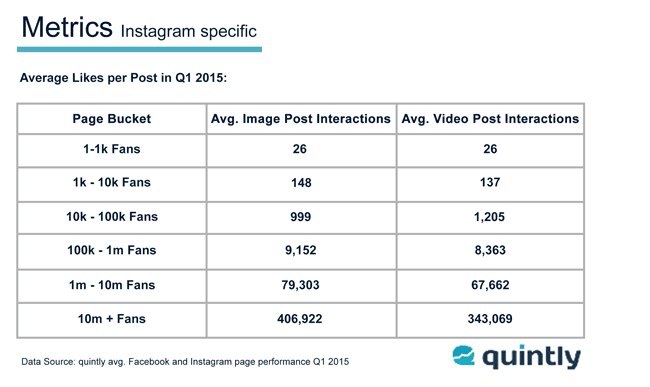
You’ve likely heard about how good posts on Instagram perform, but what do the real numbers say? An Instagram Advisor report finds that at least half of all users are following at least one or more brands, with 60% using the social site to find out more about these brands. As far as Instagram user statistics are concerned, around 75% of users will take some form of action after seeing a post that is advertised on the site. When it comes to post engagements, it varies by fan base, with interaction ranging between 26 and 34,000 per post based upon average fan base size (see chart below).
Instagram Hashtag Statistics
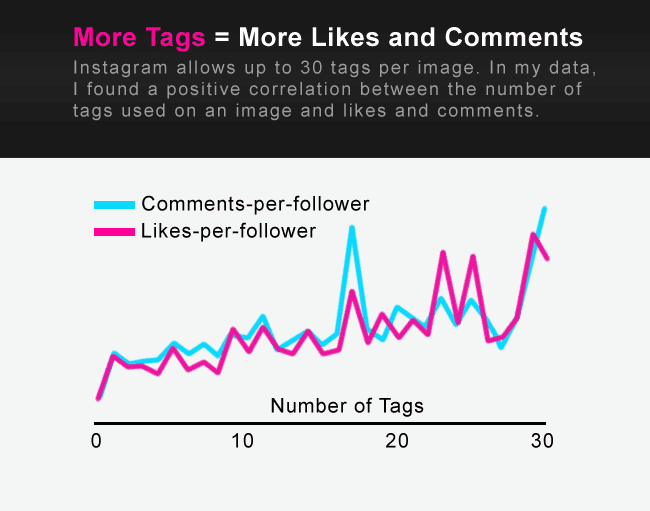
Hashtags help posts gain saturation and exposure. A Simply Measured study finds that posts containing hashtags receive an average engagement increase of 12.6%. Hashtags have become such an important element of marketing on Instagram that it’s spawned a new industry of hashtag tracking services, like Hashtracking and others.
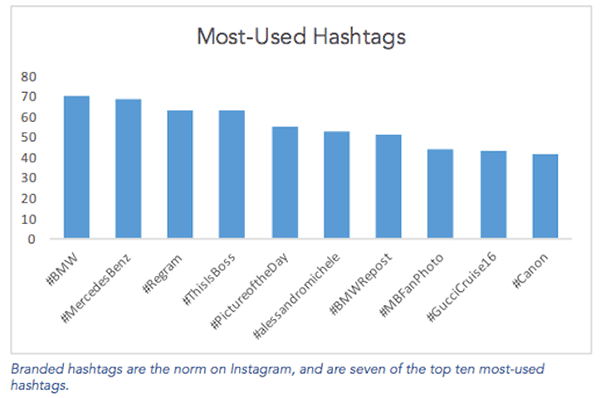
These services help businesses determine what hashtags are the likeliest to gain the most amount of traction on a given post, and they also deliver a variety of dashboard analytics to help businesses better cater their social media marketing plan for success. All told, branded hashtags are the most commonly used, representing 70% of branded posts, according to Simply Measured.
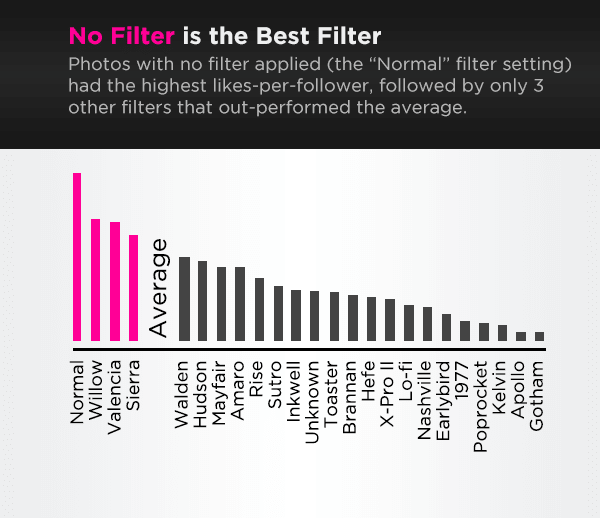
Instagram Filter Statistics
Filters are immensely popular on Instagram, with Webdam reporting that more than 60% of the most well-known brands are using filters on nearly every post. However, some reports find that using filters on posts is detrimental to brand engagement, with most users saying that they prefer a non-filtered image from a brand post instead.
Instagram Average Conversion Value
Where Instagram stands apart from the rest of social pack is found in the average conversion value. A Fool report finds that Instagram’s ad costs are 90% higher in cost than Facebook’s, but do the conversion values add up for the businesses that are spending money on these ads? In fact, Instagram gets more than 15 times the engagement than sites like Twitter and Google+ do combined, and has attracted 91% of major brands to its channel as a result.
But what about return on investment? Forbes also reports that big brands are making big gains with Instagram ads. Michael Kors, for example, attracted 34,000 new followers after running a national ad campaign on the site, while Macy’s was able to increase its followers by an impressive 15% with a whopping 128% engagement rate via national ads.
In in-depth YotPo report finds that Instagram users are 58 times likelier to engage Instagram posts versus Facebook posts, and 120 times likelier to engage Instagram posts versus Twitter posts. What’s more, users engage longer on Instagram over any other social platform, spending an average of 3.2 minutes per engagement.
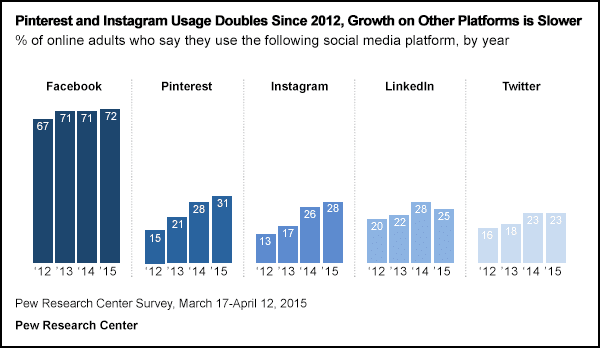
Instagram Usage Statistics
Instagram features a varied audience, even if half of its users are under the age of 24. A Pew study reveals that Instagram and its competitor, Pinterest, have grown exponentially since 2012, significantly outpacing rivals like Facebook, LinkedIn and Twitter along the way. While Facebook still boasts far more active users, it’s also been around for a lot longer, too, leaving many to believe that at some point, Instagram may catch up to this social juggernaut.
Between 2017 and 2020, Emarketer has projected an Instagram growth rate of 26 million new active users. For 2017, the growth rate is being estimated at around 15%. As compared to other social networks, which factor in at just 3% average annual growth, Instagram is growing five times as fast, which is quite impressive.
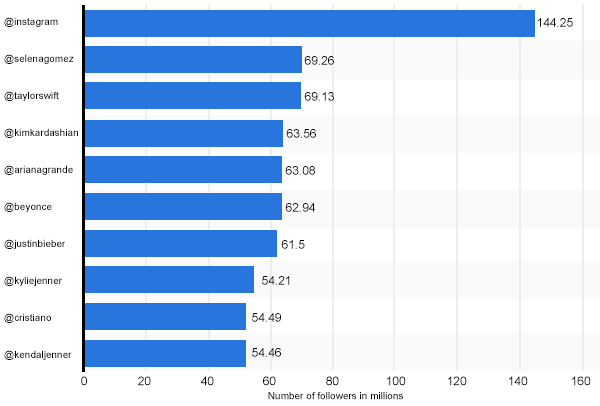
Instagram Follower Statistics
A number of celebrities dominate the Instagram follower stats column, with singer Selena Gomez topping the list at 69.26 million followers. The only account that has more followers on it is the official Instagram account. In at third place is Taylor Swift (69.13 million), and at fourth is Kim Kardashian (63.56) million.
Facts About Instagram
Need even more Instagram statistics? Here’s a long list of them to help you make smarter marketing moves for your ecommerce store.
- 59% of Instagram users are active daily on their accounts with 35% making more than two visits per day (Pew).
- 75% of accounts are based outside of the U.S. (Instagram).
- 9% of traffic originates from the U.S. (Search Engine Watch).
- 4 million Americans access their Instagram account at least one time per month (Emarketer).
- Instagram boasts a 237% follower growth rate (Media Post).
- Average adoption rates range between 23% and 32% (Media Post).
- 31% of B2C marketers view the platform as a “very important” part of their marketing method (RivalIQ).
- More than 80 million photos are shared daily (Instagram).
- Caption length and text length do not really affect engagement rates (Simply Measured).
- Photos in posts outperform videos in posts (Simply Measured).
- Brand posts contain an average of 2.5 hashtags (Simply Measured).
- Posts containing 10 or more hashtags receive 79% or more interactions (QuickSprout).
- Posts with pictures of pizza are the most popular foodie posts (Telegraph).
- Major brands place an average of 1.5 posts per day (Union Metrics).
- Mondays and Thursdays (anytime) are the best days and times to post (Elle & Company).
- 90% of brands now host an account (Simply Measured).
- 70% of feeds are ignored or missed by consumers (Instagram).
- Average engagement rate on posts is 2.3% (Union Metrics).
Even More Instagram Facts
Want even more Instagram facts? We’ve got you covered with this massive infographic (which can also be shared on Instagram, or its competitor, Pinterest).