

With newer reports, surveys and studies surfacing regarding facts about online shopping, there’s more aggregate data to pour over than ever before. As we fill our craniums with this input, a clearer picture emerges. It’s one that starkly contrasts the ongoing debate among the leading e-retailers: Which is more dominant a force for online shopping – mobile or desktop?
Numbers Still Leaning Towards Desktops
In an early January report that was released by IBM, it was found that sales via mobile devices increased by a healthy 27% throughout November and December in 2014, as compared to the same time in 2013. But, it was also noted in the report that the sales that were made via smartphones and tablets still only comprised about 23% of online sales. This leaves the bulk and magnitude of sales overwhelmingly in favor of desktop or laptop users – to the tune of 77% of all online sales.
Social Sites Driving E-Retail Sales
The IBM study also took a look at how powerful social networks like Facebook and Pinterest are driving sales between devices. Regardless of the device being used to facilitate the social referral, the numbers are healthy across the board, broadly in favor of the e-retailer enjoying a premium conversion value.
- Facebook referrals got $101.38 per order.
- Pinterest referrals got $105.75 per order.
Interestingly enough, Pinterest only just recently started offering paid ads, via “Rich Pins” – something the social network rolled out in January of 2015. One reason why Pinterest conversions are higher is because the adds do not appear like the typical sponsored ads, like ones you’d come across on Facebook. Rather, they feature curated and more trusted content that spurs enhanced consumer response and influence.
The Holiday Numbers
When discussing facts about online shopping, it’s imperative to also compare and contrast the holiday shopping season – the biggest selling season for e-retailers, period. According to IBM, online sales for 2014 saw a sharp increase, up 13.8% from the same time in 2013. This coincides with an overall market growth of 15% from year-to-year (2013-2014), nearly double the increase of online sales from 2012-2013, which was 8.5%.
Meanwhile, even though sales increased this year, the actual order value was down by about 8%. This equated to the average internet purchase, regardless the device, being at approximately $119.33. One reason for this lower average purchase value is due to shoppers spreading out holiday purchases over two months, starting in November.
In addition, the lower value of the average order was also attributed to the countless online stores that were offering free shipping – which made some shoppers combine stores they were shopping at because there was no reason to bundle orders just to get free shipping.
The most interesting part of the IBM report was this: Online shopping over the holidays in 2014 was dominated by desktop and laptop users. While smartphones helped, driving about 31% of all traffic, they only accounted for a meager 9.1% of all online sales. Tablets fared even worse, accounting for just 13.4% of traffic and 13.4% of online sales. Somehow, even though tablets drove less traffic, they converted a lot more sales than smartphones.
All in all, IBM’s report concluded that the Commerce Department recorded record-setting sales over the holiday season this year. Retail sales, overall, increased by 0.7%, accounting for a $449.3 billion haul. Big box retailers like Target and Wal-Mart said they enjoyed record-setting traffic over Black Friday and Cyber Monday, noting that it was the highest amount of traffic they’d ever gotten over the holiday shopping weekend.
Online Spending by Gender, Generation
In lieu of all of these online shopping statistics, the question begging to be asked is: Who is shopping online, by what gender and what generation? While women control approximately 80% of all online spending in the U.S., according to the Wall Street Journal, such is not the case for ecommerce – where men are spending about the same amount as women are.
- 57% of women made online purchases in 2013, as compared to 52% of men, nearly split right down the middle, according to a report by SeeWhy.
- 22% of men made purchases from their smartphone versus just 18% of women.
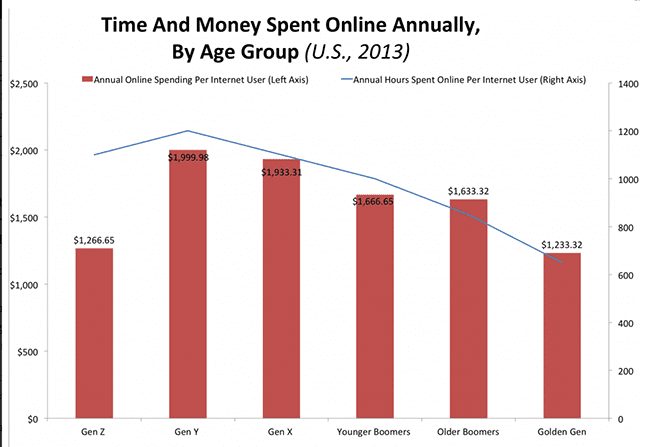
- Millennials – persons between the ages of 18-34 – are the biggest spenders online, spending about $2,000 per year on ecommerce, even though they are in lower income brackets.
- Baby boomers and older Americans are coming around to the idea of mobile commerce. About one out of every four mobile shoppers in the U.S. is over the age of 55.
- Those who shop online tend to have healthier incomes than the average American. According to an Experian survey, 55% of online shoppers have household incomes that exceed $75,000; 40% have household incomes that exceed $100,000. But the median U.S. household income is just $50,000 per year.
All said and done, ecommerce is one of the healthiest, fast-growing industries in the world. Since 2008, online sales have increased by over 40%, telling of such growth. Online shopping currently accounts more than 11% of all retail sales worldwide, feeding an estimated $1.4 trillion global industry that is growing by over 10% per year.
By the end of 2015, experts at BigCommerce are predicting that the ecommerce industry will eclipse the $2 trillion marker – a number that is larger than most country’s gross domestic product (GDP).