
But how much do social commerce facts influence ecommerce shopping trends? One could say they are the fuel in the referral vehicle. Not so convinced? Wait until you read this breakdown on social shopping statistics. Then #TweetThis! (or Like, Share, Favorite, etc.).
Social Shopping is Growing
Social shopping is growing faster than Jack’s magical beanstalk. In a Shop Socially white paper, which compared year-over-year growth of social media based upon incoming traffic metrics, it was found that from 2012 to 2013, traffic increased by a staggering 273%. But that was not withstanding the growth that was noted in sales from that same time period, which amounted to a whopping 357%.
Given that we are two years ahead of that last metric, and that the numbers have not been slowing down a bit, it’s eye-opening to think of the growth that’s been experienced.
The study also found that during these time periods:
- Revenue uplift increased by 17.8%.
- Social sharing and purchases increased traffic by 8.5%.
- Social referrals resulted in 2.1 more visitors for websites.
- SEO rankings improved for over 90% of ecommerce stores due to social signals.
- Email campaigns saw a 63% increase in sales from social media.
- Facebook flash sales generated $17 in revenue, on average, per fan.
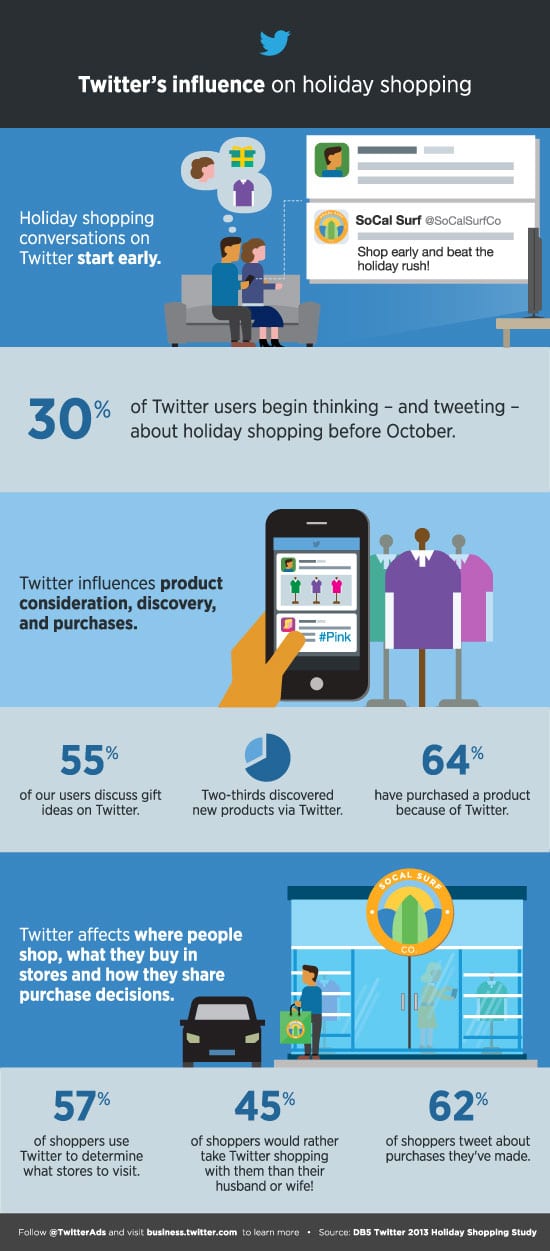
Holiday Tweets Start in October
In a Twitter breakdown of seasonal social commerce facts, it was found that lots of users actually start tweeting about their holiday shopping before October even sets it. Now bear in mind that this study references 2012. But the real only difference that you will see now is that these numbers are larger today, three years later.
In a survey that was conducted alongside the study, some interested social commerce facts were noted:
- 45% of people say they’d rather shop with Twitter by their side than their significant other.
- 64% said that they were influenced to buy a product because of a tweet or an ad that they saw on Twitter.
- 57% said that they relied upon Twitter to find the stores that they wanted to shop at.
- 30% of Twitter users are already tweeting and talking about holiday shopping long before the official season sets it.
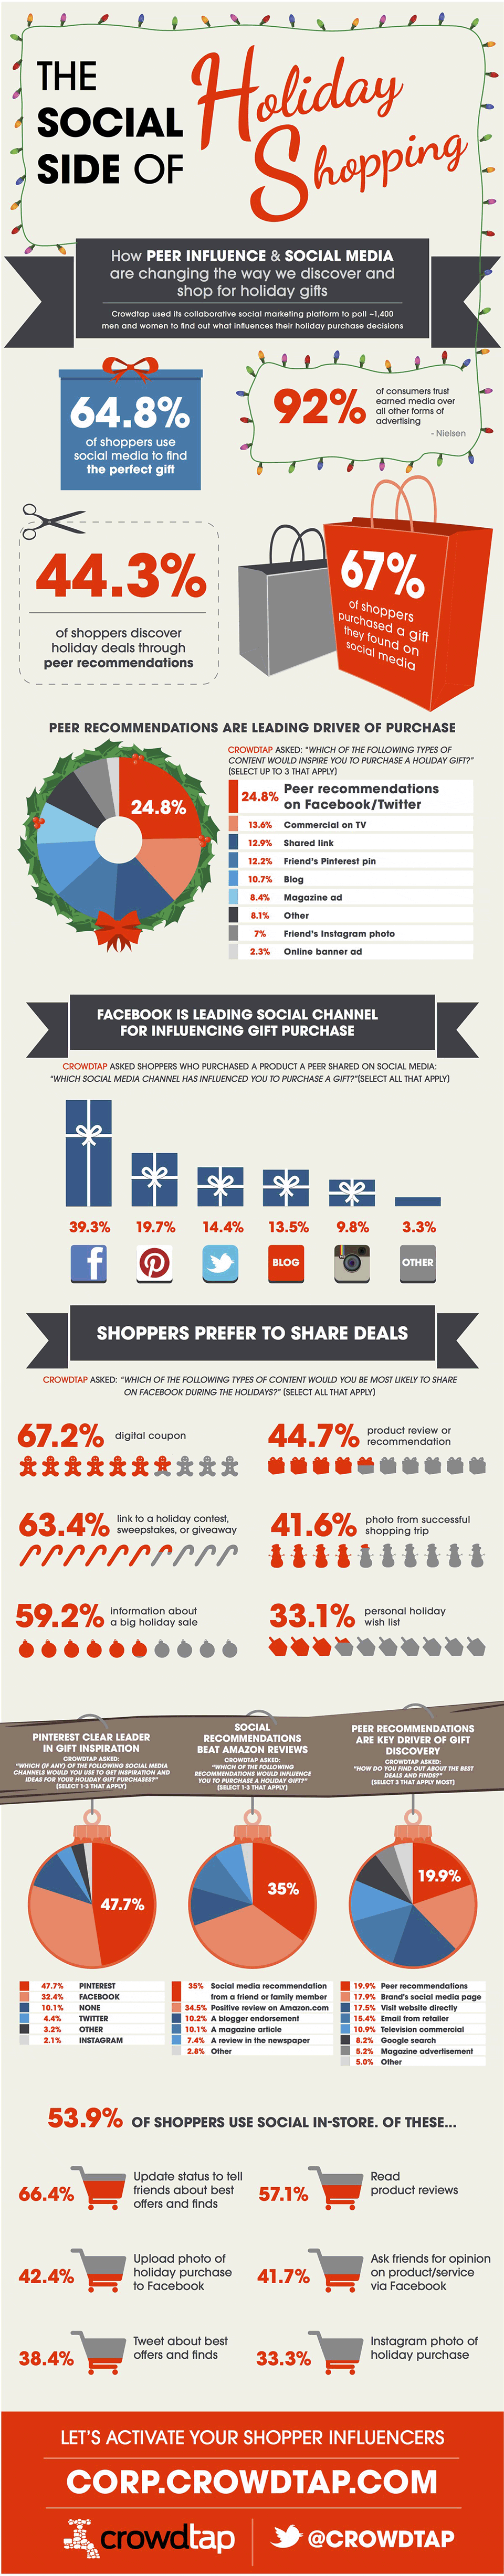
Influence on Holiday Shopping
In a related crowdtap poll, it was found that at least 65% of social users rely upon social media to find a gift for someone during the holidays. The study polled 1,400 male and female subjects, and found that the majority use Facebook, Twitter or Pinterest when searching for holiday gifts. Interestingly enough, 67% of them would actually purchase an item that they researched on social media after the fact.
The study also found that:
- Peer referrals helped Facebook and Twitter drive 24.8% of purchases.
- 53.9% of shoppers used their social accounts while shopping in a store.
- 38.4% of shoppers tweeted about what they found including best offers.
Shares Create Conversions
So just how powerful is the social media juggernaut these days, as far as free advertising for ecommerce stores is concerned? A Vision Critical white paper helps us better understand. A study they conducted, one which resulted in over 6,000 responses, found that over 40% of all social media users have purchased an item online or in the store after sharing it on Facebook, Twitter or Pinterest.
The study also found that:
- 50% of all social media-related purchases occur within one week of sharing the item.
- Social media drives equaled amounts of both in-store and online purchases.
- Pinterest is the most likely to encourage spontaneity with purchases.
- 74% of the population uses Facebook, 24% uses Twitter and 15% uses Pinterest.
Polyvore Is King
Polyvore is the order value king, according to Venture Beat, driving an average $383 conversion value. That’s compared to Facebook ($90), Twitter ($60) and Pinterest ($200). But, it should be noted that most referral conversions that are driven by Polyvore are fashion related, which typically cost more than referrals that come from the other social networks.
One study that examined 700 million social shopping sessions found that:
- Facebook generated $10.7 million in sales.
- Polyvore generated $6.34 million in sales.
- Pinterest generated $2.1 million in sales.
- Twitter generated just $93,000 in sales.
Tech Junkies Love Facebook & Twitter
While Polyvore dominates the higher-value fashion referrals, hence its ability to compete with Facebook’s dominant status as the top referring social engine, Twitter and Facebook are the primary drivers of technology related sales. About 34% of Twitter purchases and 25% of Facebook purchases are for tech-related items, according to Vision Critical.
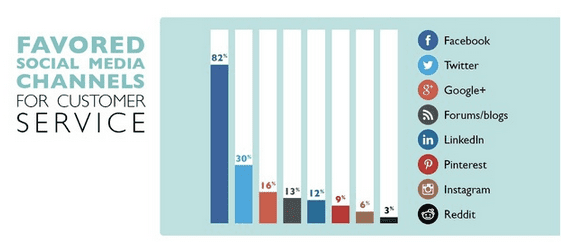
U.S. Brands Favor Facebook
Still, by and far, the familiar white and blue of Facebook rings true to most Americans and brands. A Still Media white paper, which was based upon a study of 1,000 consumers, found that this was entirely true, showing that 82% of brands and people still favor Facebook as the leader in social commerce.
- 33% of consumers use Facebook to reach a customer service agent.
- 44% of consumers want a Facebook response from brands over any other social media portal.
- 47% of consumers think Facebook resolves customer service inquiries faster.
- 72% of consumers interact with brands on Facebook.
- 33% of consumers use Facebook to find special offers.
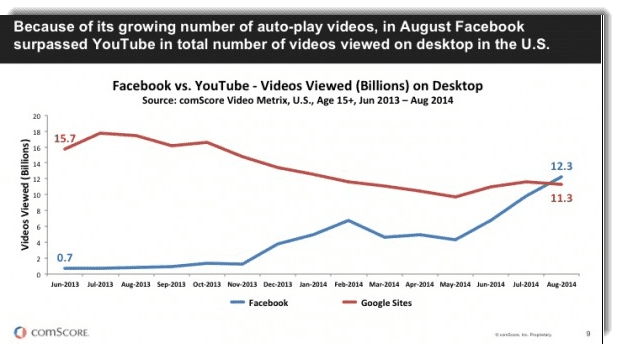
Facebook Beating Youtube for Video
Now we have all been told that YouTube is the leader in video social media. But not so fast, because a new king is being coronated: Facebook. The leader in social media said that it was getting over 1 billion views on videos each day, according to a Marketing Land report.
But the real catch is this: YouTube mandates that videos are clicked by the user to play, whereas Facebook simply auto-plays them. This means that you can often scroll down in a news feed from your friends and see the videos auto-play, but that does not mean that you’ve necessarily watched them.
But as of August, 2015, comScore said that Facebook was getting 12.3 billion views per month, 1 billion more views than YouTube generated. Yet you won’t hear Facebook whining or changing their video auto-play function anytime soon because more plays mean more advertising dollars. It’s just another way that Facebook is aiming to become not only king of social media, but king of video media, too; something that will be a contended number as more social commerce statistics in 2015 develop.
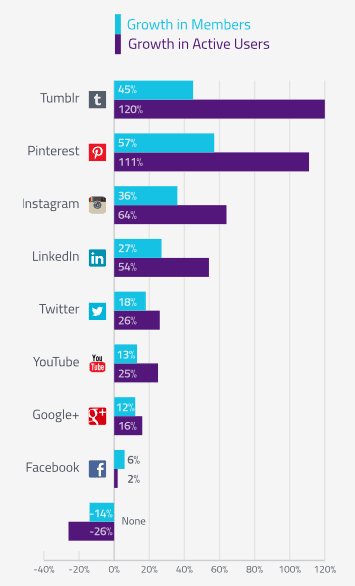
Fastest Growing Social Network
If you thought that you already know what the fastest growing social network was, you may need to think again. Facebook leads the pack with 1.34 billion active monthly users, but Tumblr’s active user base has increased by a whopping 120% in comparison to Facebook’s stark 2%, according to Global Web Index.
Don’t worry, Facebook won’t be overtaken any time soon, if ever. Yet it’s interesting to note that a blogger site like Tumblr is slowly making a stake against other sites like Instagram, which was formerly the fastest growing social network, according to Tech Crunch.
The World is Connected
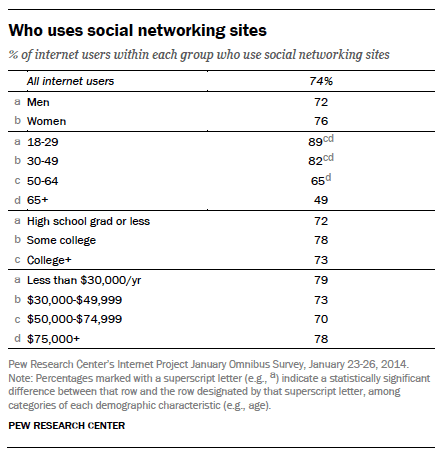
Social networking could easily be considered the most dominant thing for online activity since there was even an internet. Telling of this is a recent Pew Social Networking Fact Sheet. It underscores the notion that 74% of online adults are active on social networks, with men (72%) and women (76%) being nearly as active as each other.
And the most commonly used social networks worldwide are:
- 71% of online adults are using Facebook.
- 28% of online adults are using Pinterest.
- 28% of online adults are using LinkedIn.
- 26% of online adults are using Instagram.
- 23% of online adults are using Twitter.
Social Commerce Statistics & Facts
Indeed, social media has become a driving force in our daily lives. From the average 150 times per day that we look at our smartphones, to the daily tweets we send about brands we like, deals we found or products and services that we want to try (or, ahem, the tweet, like, share, favorite or pin that you will send out about this awesome blog). Social media has enabled us to connect in a way never before thought possible. As a result, it has changed branding, advertising and internet marketing forever. And that’s a good thing.
We leave you with this awesome infographic on social media ecommerce statistics. The information contained within may surprise some of you. As you will clearly see, it’s a digital world in which we live. Perhaps the most exciting part is that social media is still in its infancy, and that the best is still yet to come.