

The problem is that there is so much research out there that hunting it all down is time-consuming. Because of this, we’ve compiled the most important and reliable content marketing statistics available online, expert tips that today’s leading fractional CMOs and marketers use as an ace up their sleeve to create winning content that drives targeted, organic traffic and conversions.
Statistics on Content Marketing Usage
The ability to reach your target audience online is one of the most important benefits of content marketing.
Before we dig in, here are some statistics that drive home the need to have an efficient ecommerce content marketing plan in place:
➡️ 25% of US adults are online almost all the time (Statista).
➡️ 77% of adult US citizens use the internet every day. The majority of them go online at least once. (Statista).
➡️ 4 billion people have access to the internet globally. This includes 3.7 billion active mobile users and about 3 billion people using social media (Statista).
➡️ 91% of B2B marketers use content marketing to reach customers, according to Content Marketing Institute (CMI).
➡️ Content marketing is a key strategy for 86% of B2C marketers (CMI).
Content Strategy Statistics
Can effective content marketing and strategy yield viable results? The simple answer is: YES.
According to the latest content marketing industry statistics, approximately 77% of B2C marketers dedicate themselves to content marketing, which results in a procured ROI that’s as high as 24%.
Meanwhile, a staggering 63% of businesses lack an official content strategy, according to Marketing Profs and the CMI. In a related report, just 36% of marketers said they are happy with the way they create content.
According to Zazzle Media, 60% of people find it difficult to consistently create content because the content they produce may not satisfy them, even when they produce it. All said and done, about 65% of people have trouble creating engaging content for their online brand.
Content Marketing ROI Statistics
Of course, the content you create should have a solid ROI that you can back it up with. After all, why else are you spending so much time and effort if you are not drawing in organic traffic and rankings that help encourage your target market to engage with your brand?
Here are some content marketing ROI statistics that you can glean from to get a better idea of what’s working and what’s not:
➡️ 72% of marketers say that digital content marketing boosts engagement (CMI).
➡️ 72% say it has increased lead generation (CMI).
➡️ Video content marketing can increase engagement by as much as 60% (Tiger Marketing).
According to Twitter’s metrics, the platform offers great content marketing ROI:
➡️ Twitter has been helpful to 66% of people in finding a new business.
➡️ 69% of people have purchased something thanks to Twitter.
Stats on SEO and Content
SEO and content strategy are hard to separate. This is because search engine optimization determines how your content will appear on search engines. The visibility and click-through rate of your ad also determines whether people see your ad and go to your website. They both can work in synergy, though.
Research by Skyword suggests that the best content marketers pay more attention to engagement and conversions rather than focusing just on traffic. This is because the only type of traffic you really want coming to your ecommerce site is engagement traffic, or something called “transactional traffic.” This type of traffic is the most likely to convert into a new sale or subscription.
When it comes to content marketing effectiveness, images are a great place to start. Images get more views than content without them, so they are a great way to reach a wider audience. Content with images also gets shared more, so images can help spread your message further.
Several different types of images are available, but the most popular is an infographic. In fact, infographics are the most shared type of content, according to OKDork. Even Forbes agrees: infographics are effective for 84% of marketers that use them.
Pro Tip: Scroll to the bottom of this blog… you’ll see an awesome infographic we added because it drives more engagement and helps us get more shares and back links.
Video Content Marketing Statistics
Marketers are increasingly using videos in content marketing. The Content Marketing Institute’s content marketing statistics show that 72% of B2B marketers use video, and 76% of B2C marketers. More stats include:
➡️ YouTube video is a priority for 48% of marketers.
➡️ 46% plan to prioritize Facebook videos.
➡️ The majority of millennials trust video, while half of those between the ages of 18-and 34 would stop what they’re doing to watch a new video.
To learn more about how videos increase ecommerce conversions, read our related guide: 7 Reasons to Use Ecommerce Product Videos.
Mobile Content Marketing Statistics
It’s no mystery, the Mobile Commerce revolution is well underway. More searches are now being conducted on mobile devices than on desktop computers, with statistics finding that more than 50% of all searches – including for ecommerce products – are conducted from a mobile device.
➡️ 79% of all media content is consumed on mobile phones (Statista).
➡️ 70% of social media is consumed on smartphones (Statista).
➡️ Mobile email opens increased by 30% in the last year (Optin Monster).
➡️ Over the last two years, Google’s research has found an 80% increase in “best” searches (Google).
➡️ 53% of visitors leave your site if the content doesn’t load within three seconds on a mobile device (Google).
➡️ 62% of companies have yet to optimize for Voice search (Google).
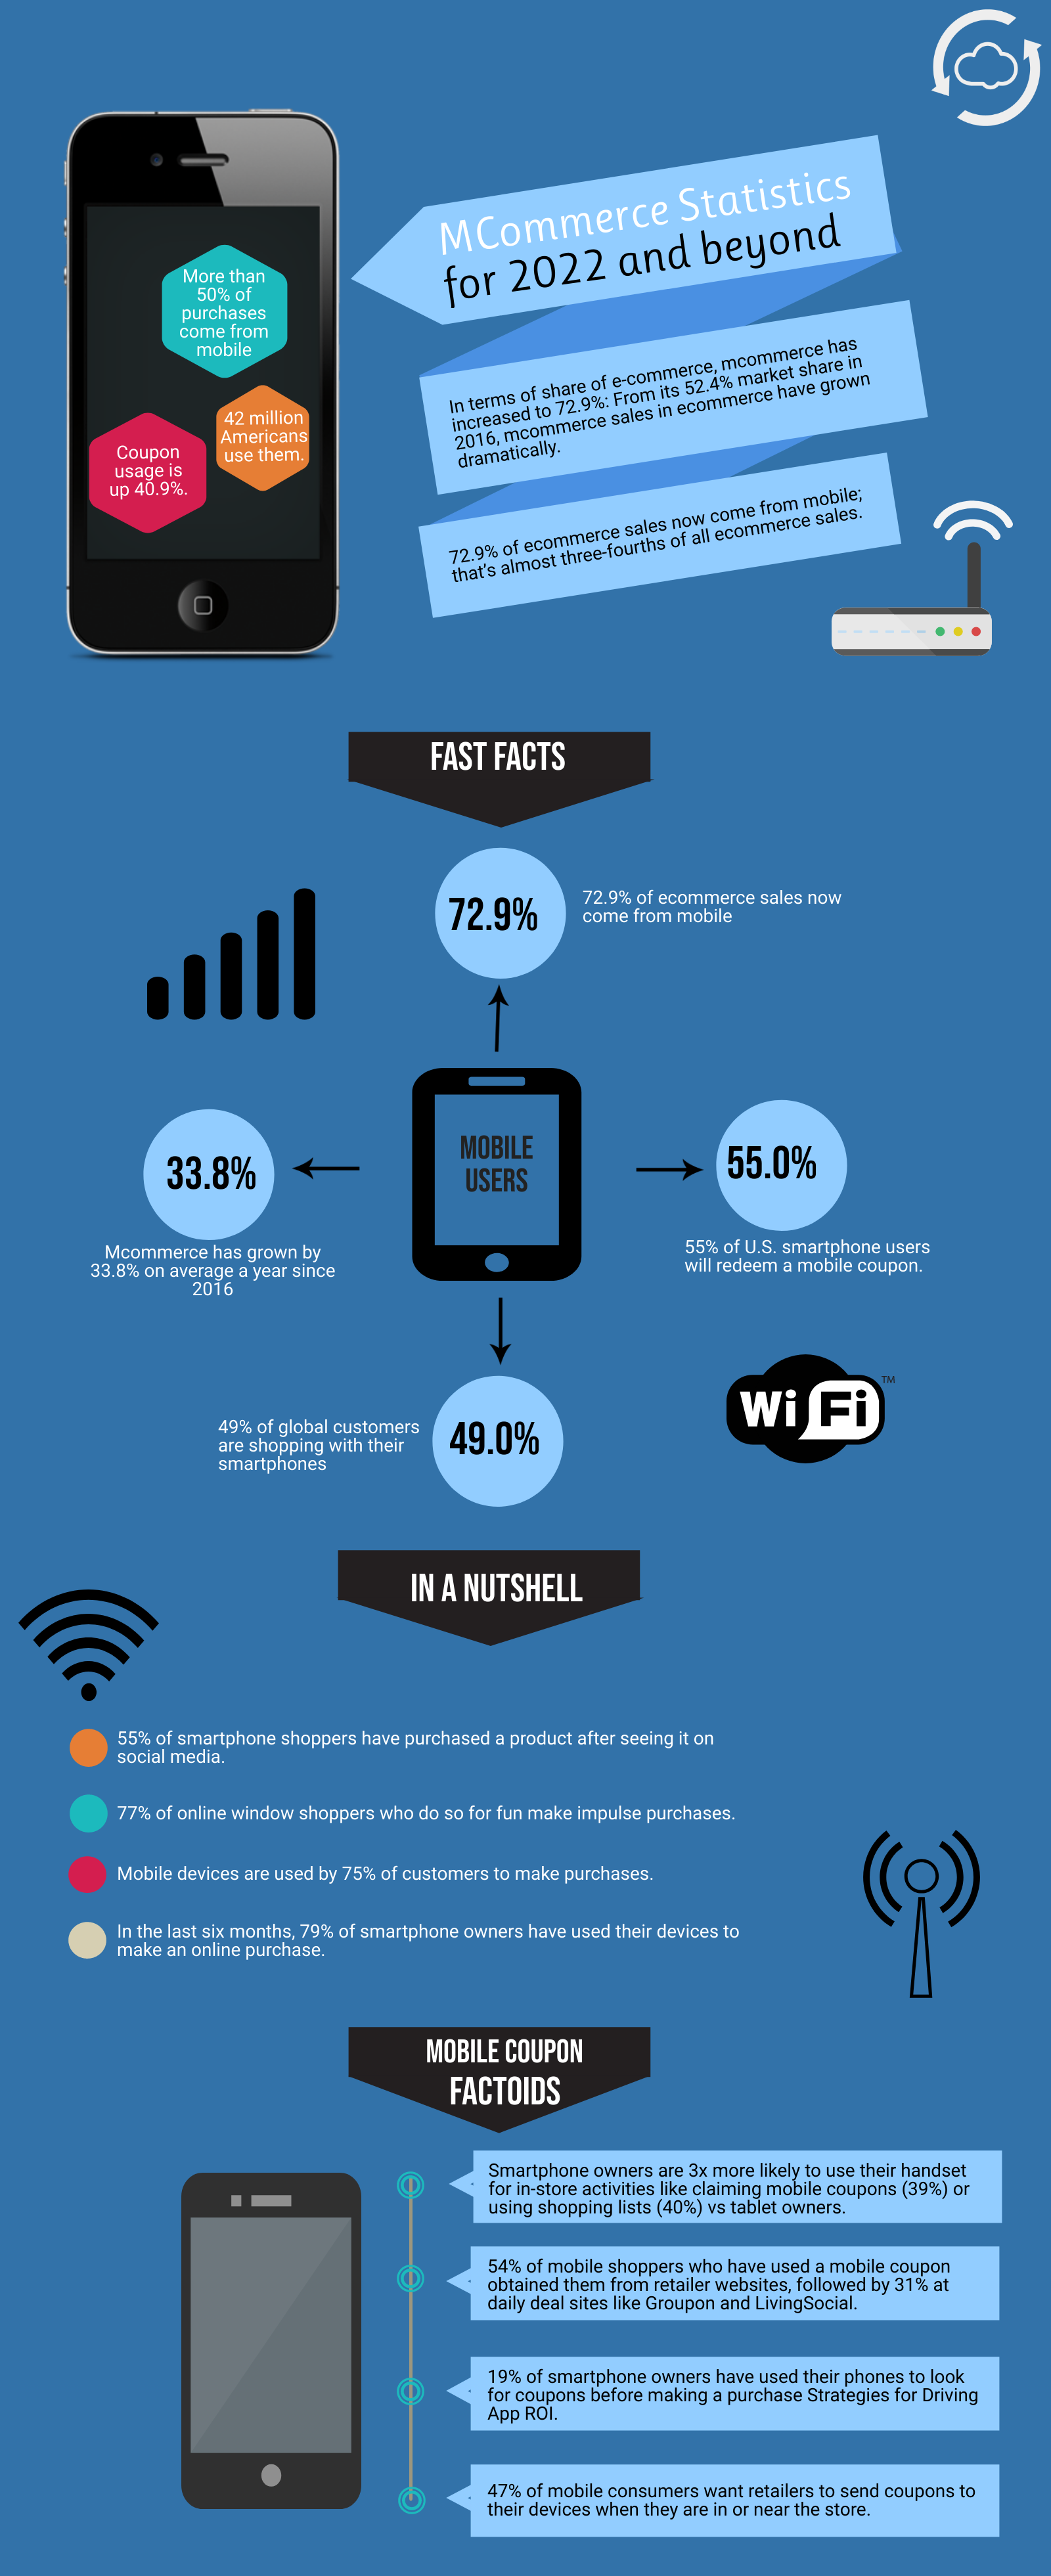
It’s always a good idea to take a look at your ecommerce operation from top to bottom to ensure that your online store is as optimized as possible for mobile commerce. To help you get a head start, have a look at our related guide: 50 Facts About Mobile Commerce for 2022.
Need Even More Tips?
We leave you with this illustrated infographic to better help you understand some of the most pertinent statistics you should know about mobile commerce in 2022 and beyond.