
Mobile phones have become such an engrained part of our daily lives that we overlook just how often we’re using them. But smart online retailers are well aware that more than 55% of their traffic (and sales) comes from smartphone handsets. Putting this into better perspective is a recent report by Pew, which finds that 95% of Americans have a cellular phone and 77% of them are using a smartphone.
How much are Americans using their smartphones? According to an eMarketer study, the average person spends about 3.5 hours a day glued to the AMOLED screen of their device. By the end of this year, people will spend more time using their smartphones than watching TV.
As we’ve previously reported, ecommerce stores generated at least 35% of all sales in 2018 from mobile devices, accounting for 40% of Black Friday’s massive, multi-billion dollar haul. What do the mobile commerce statistics for 2019 look like?
Read on to learn more.

Mobile’s Climb to the Top
Up until just recently, mobile commerce wasn’t the leader. As of 2015, the scales were balanced entirely in favor of desktop shoppers, with desktop ecommerce sales outpacing mobile commerce sales by a 77% to 33% ratio. Between 2015 and the present day, the popularity and usability of smartphones have increased ecommerce traffic from just 31% to a more robust 55%.
Last year, mobile commerce sales surged over the holidays, with Shopify reporting that mobile sales comprised 66% of the ecommerce haul during the Black Friday and Cyber Monday weekend.
The Surge in Handset Spending
The palpable increase in handset spending can be easily explained. Globally, smartphone usage has increased dramatically over the past five years. Thanks to recent advancements in technology that have decreased costs of ownership, smartphones are the go-to for 66% of internet users worldwide, according to a study by Zenith, and factor around 77% of total internet usage.
Across all age demographics, smartphones are the internet-enabled device of choice due to their compact size, long battery life and connectivity. So, it makes perfect sense why mobile commerce is set to outpace desktop shopping in 2019 and beyond, with Statista finding that smartphone usage will multiply tenfold this year.
One-Click Checkouts Changed Everything
Mobile commerce wasn’t always the go-to for online shoppers. Back in 2005, it was clunky, sluggish and poorly optimized for the end user experience. Looking back to 2017, a Retail Dive report found that just 40% of retailers even offered a mobile website for shoppers, and just 60% of that demographic was planning to integrate one by year’s end.
The big game-changer in the mobile commerce revolution was none other than Amazon and its aspirations for global ecommerce dominance. Its patented one-click checkout was the brainchild of Jeff Bezos and company, setting the stage for a surge in handset spending, the likes of which had never been seen before.
The result of such a candid integration of ease in spending would entirely reshape mobile shopping statistics and leave other online retailers scrambling to catch up, empowering Amazon to command a dominating share of 49.5% of all ecommerce sales worldwide as of the present day.
Just how much of a factor was Amazon’s move into one-click checkout territory? In 2016, Business Insider reported that:
- The average mobile shopper spent at least 100 minutes on Amazon’s website, just 20 minutes on Target’s website and a palsy 14 minutes on Walmart’s website.
- Mobile shoppers returned to Amazon 150% more often than they did to Walmart and 350% more often than they did to Target.
- 70% of Amazon’s holiday shoppers made purchases from a mobile device.
- 61% of mobile-only shoppers were exclusive to Amazon.
Who’s Using Mobile to Shop Online?
With this much money being spent on mobile devices, it’s natural to wonder who the power shoppers are and how the numbers break down. Current statistics on mobile shopping can help us better understand how this plays out.
Around 2 billion people will make purchases from a mobile device in 2019, with about 95% of shoppers conducting research from their device prior to completing an in-store or an online checkout. About $1 in every $4 generated in ecommerce comes from mobile, with annual spending exceeding $35 billion.
While mobile’s average conversion rate is just 0.55%, as compared to desktop’s healthier 2.06%, average order value exceeds $100 across all devices (tablets and smartphones). Around 59% of smartphone and tablet users conduct research on their devices, with 59% of them planning to make the final purchase from the same device.
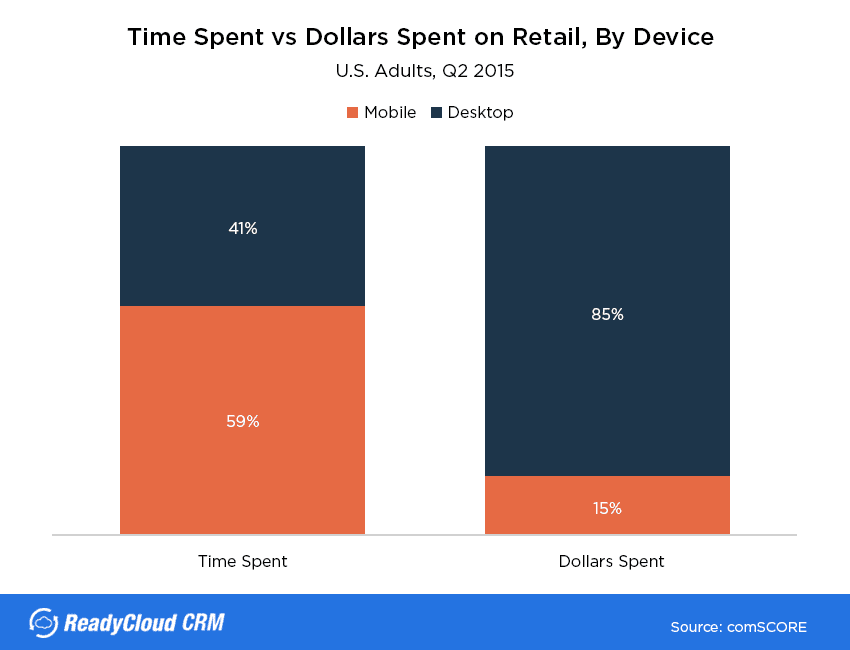
Interestingly, mobile users spend 59% of their time shopping versus closing the sale only 15% of the time, as compared to desktop users, who spend 41% of their time shopping versus closing the sale 85% of the time. So, while mobile shopping is popular, the conversion rate is still largely in favor of the desktop user.
Mobile Commerce Statistics for 2019
Mobile is becoming the new standard for ecommerce. These statistics on mobile commerce for 2019 paint the full picture:
- 53% of global online traffic comes from mobile devices (Statista)
- 57% U.S. online traffic comes from mobile devices (BrightEdge)
- 200% increase in interactions when mobile devices are used (Google)
- 80% of users will complete sales when sites offer Q/A for mobile users (Google)
- 72% of all digital ad spending will go to mobile this year (Marketingland)
- 68% of companies are now using mobile marketing as a strategy (SalesForce)
- 31% increase in Black Friday sales from mobile year-over-year (Adobe)
- 33% increase in mobile payments by 2021 for an estimated $3.38b (Allied Market Research)
- 32% increase in digital wallet usage from mobile by 2022 (Zion Market Research)
- 71% of mobile purchases come from email influence (Adobe)
- 85% of users begin a sale on one device and complete it on another (Google)
- 52% of mobile shoppers will shop elsewhere after a bad experience (Google)
- 57% of mobile shoppers will abandon the cart if load time is 3 seconds or greater (Google)
- 82% of shoppers browse ecommerce stores from mobile while in-store (Omnicore)
- 62% of shoppers compare prices from mobile devices before buying (LinkedIn)
- $1 trillion in spending offline was influenced by mobile in 2018 (Biznessapps)
- Mobile commerce sales topped $626 billion in 2018 (SmartInsights)
- People spend more than 140 minutes per day browsing their smartphone (Tech Price Crunch)
Will Mobile Overtake Desktop?
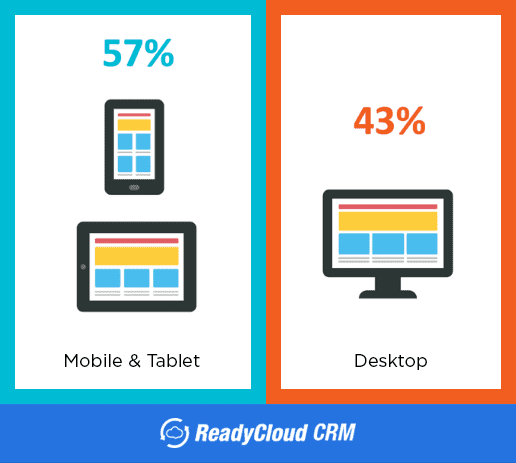
If you’re wondering whether mobile will overtake desktop, the simple answer is that it already has! As of late 2017, Search Engine Land reported that smartphones and tablets accounted for at least 57% of internet usage worldwide. Interestingly, the study noted that search queries drastically varied between desktop and mobile, with the results being different 80% of the time.
While mobile is certainly a force to be reckoned with, there’s still plenty of room for desktop. Certainly, ease of use, accessibility and simple checkouts have helped usher in a new age of online shopping. But the numbers still don’t lie: Users spend more and convert more often on a desktop, and by a large margin.
It goes without saying that ecommerce retailers will want an integrated, two-way marketing strategy when trying to attract online shoppers. But, one approach shouldn’t necessarily outdo the other, especially when the average conversion value for desktop users requires less spend and is two times greater than mobile.
Need even more info? Take a look at this infographic on mobile shopping statistics we’ve created.