
As the holiday shopping season draws neigh, the most recent social commerce statistics for 2015 are heating up (even though it’s nearly the dead of winter). The findings may come as a surprise to you; unless you are a seasoned ecommerce and social commerce marketer.
But the truth is that many online retailers are not the most profound social marketers, which is why information such as this is always helpful to add to your holiday reading dish. We’ll deliver an uncanny array of social commerce facts, statistics, metrics and numbers for you to crunch in your noodle, so you can better prepare for the shopping rush that’s just around corner; as well as make any small changes that are needed to boost your social marketing plan for Q1 of next year and beyond.
Social Commerce is 5% Of All Online Retail
![]()
So just how big a juggernaut has social commerce grown into and why is it important that you have and maintain a strong presence on social media? Well according to Ad Week, social commerce represents 5% of all online retail revenue for 2015. Sounds like a small number at first. But when you add it up, this accounts for $15 billion.
85% of social commerce orders are generated by Facebook, with an average spend of $55. Polyvore is first in order value at $66 per order, with Instagram in second place at $65, Pinterest in third at $59, Facebook sitting in fourth place ($55) and Twitter in fifth place at $47.
Social commerce revenue from 2011 through 2015 is shown in this chart below. In 2014, the estimated global social commerce revenue was projected to amount to $20 billion. Currently, experts say that this number will grow by 50%, exceeding $30 billion by the year’s end.

Facebook Is A Dominating Force
![]()
Even though Facebook has the fourth highest order value, it’s the most sought after social commerce engine, explains B2C. A majority of shoppers (53%) between the ages of 18 and 34 say that they rely upon Facebook to find their next shopping opportunity. In fact, 50% of all social commerce referrals are generated by Facebook, not to mention that 64% of all social commerce revenue is generated by this platform, too. By comparison, Pinterest generates just 16% of all revenue.
- According to Fact Browser, Facebook generates 65% of all UK buy button sales that are referred from social media.
- Facebook also accounts for 64% of all US social media buy button referrals.
- 54% of consumers rely on Facebook to find out about new brands or learn about buying opportunities.
- 74% of US personal care brands maintain a strong presence on Facebook.
- 95% of US department store brands maintain a Facebook page.
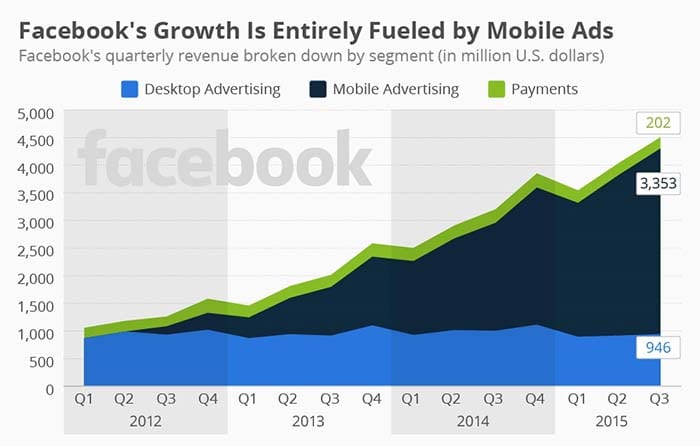
Mobile ads are the bread and butter for Facebook. Let’s also bear in mind that Facebook is not really a social media engine (yes, it offers this functionality). Rather, much like Google is not a search engine, either (but also offers good search functionality), Facebook is a marketing platform. The goal is to lure in users to build a strong fan base, so that mobile and desktop ads can be sold to businesses, thus feeding the revenue engine of this ever-growing social beast.
YouTube Is Still On Top
![]()
YouTube is still one of the most widely used and popular social media platforms. Even though Facebook is doing its best to catch up, they are not winning over any new fans in light of recent accusations of cheating and manipulating the view counts, as highlighted in a Digital Music News investigative report. With Facebook counting non-views as real views to drum up the numbers of its competing video service, it has to make you wonder why? The simple answer: because YouTube is untouchable.
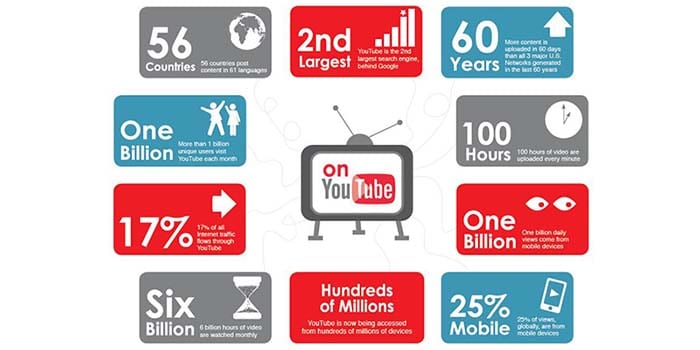
The most recent YouTube Press Statistics that were issued by the company are telling of this.
- YouTube retains over 1 billion users. That’s one-third of all people who use the internet.
- YouTube has more domestic reach than any US television network.
- Views are up worldwide by 60% over the past two years.
- Users are flocking to YouTube three times faster than they ever have before.
- 80% of all views are generated outside of the US.
- Over 50% of views come from a mobile device.
- Partner revenue has increased by 50%.
- Over $1 billion has been tendered to outside rights holders from YouTube views.
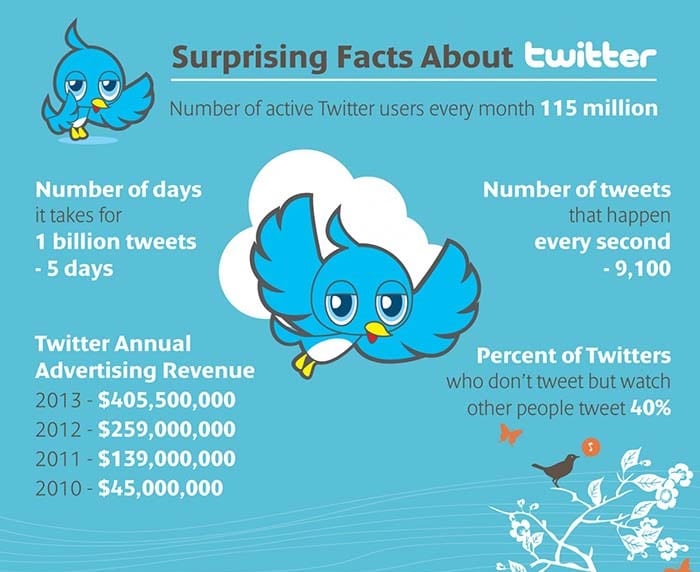
Twitter Is A Major Player
![]()
Twitter, in spite of its odd 164 character limit, has managed to stay somehow relevant in an ever-evolving social media world. With the addition of Twitter Cards for advertising, short videos and newer analytics, the company is trying to grow its revenue while competing against its rivals. It’s staying afloat, even in lieu of losing its CEO, Dick Costolo, as reported in Bloomberg.
- Since it was launched back in 2006, Twitter has facilitated 300 billion tweets.
- At the same time, there’s an estimated 20 million fake twitter users.
- This is circumvented, however, by the estimated 241 million active twitter users, of which 184 million are mobile users.
- Still, the platform has managed to generated nearly half a billion in revenue year-over-year since 2013, as the below chart reflects.
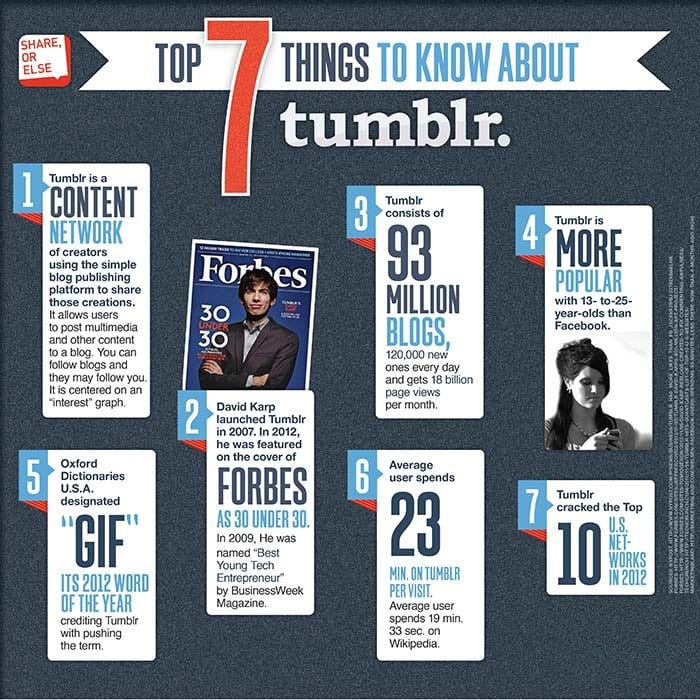
The Tumblr Effect
![]()
Overlooked until just very recently is the blogging social platform Tumblr. But it has been making major headway and is shaping up to really make an impact in the near future. It’s now hosting over 138 million blogs that offer over 62 billion posts for readers to enjoy. But how do the metrics add up? We gleaned some stats from Search Engine People to find out.
- Tumblr visitors stay 14 minutes longer than on any other social site.
- Average users visits over 60 pages per month.
- 35% of audience makes $50,000 or more per year.
- 65% of audience is college educated.
- Growth rate has exceeded 74% since 2013.
- Tumblr is rated number five for most visited sites in the US.
The Future Of Social Commerce
![]()
As you can tell by this brief breakdown of social media ecommerce statistics for 2015, social commerce is indeed very healthy. As time passes, it’s entirely possible that a new contender enters the ring. With sites like Twitter on the downfall in recent months, it’s not that farfetched to think that other platforms like Tumblr or Pinterest or even Instagram could take over its slot. When and if the time comes, rest assured, we’ll be reporting on it to keep you in the know.
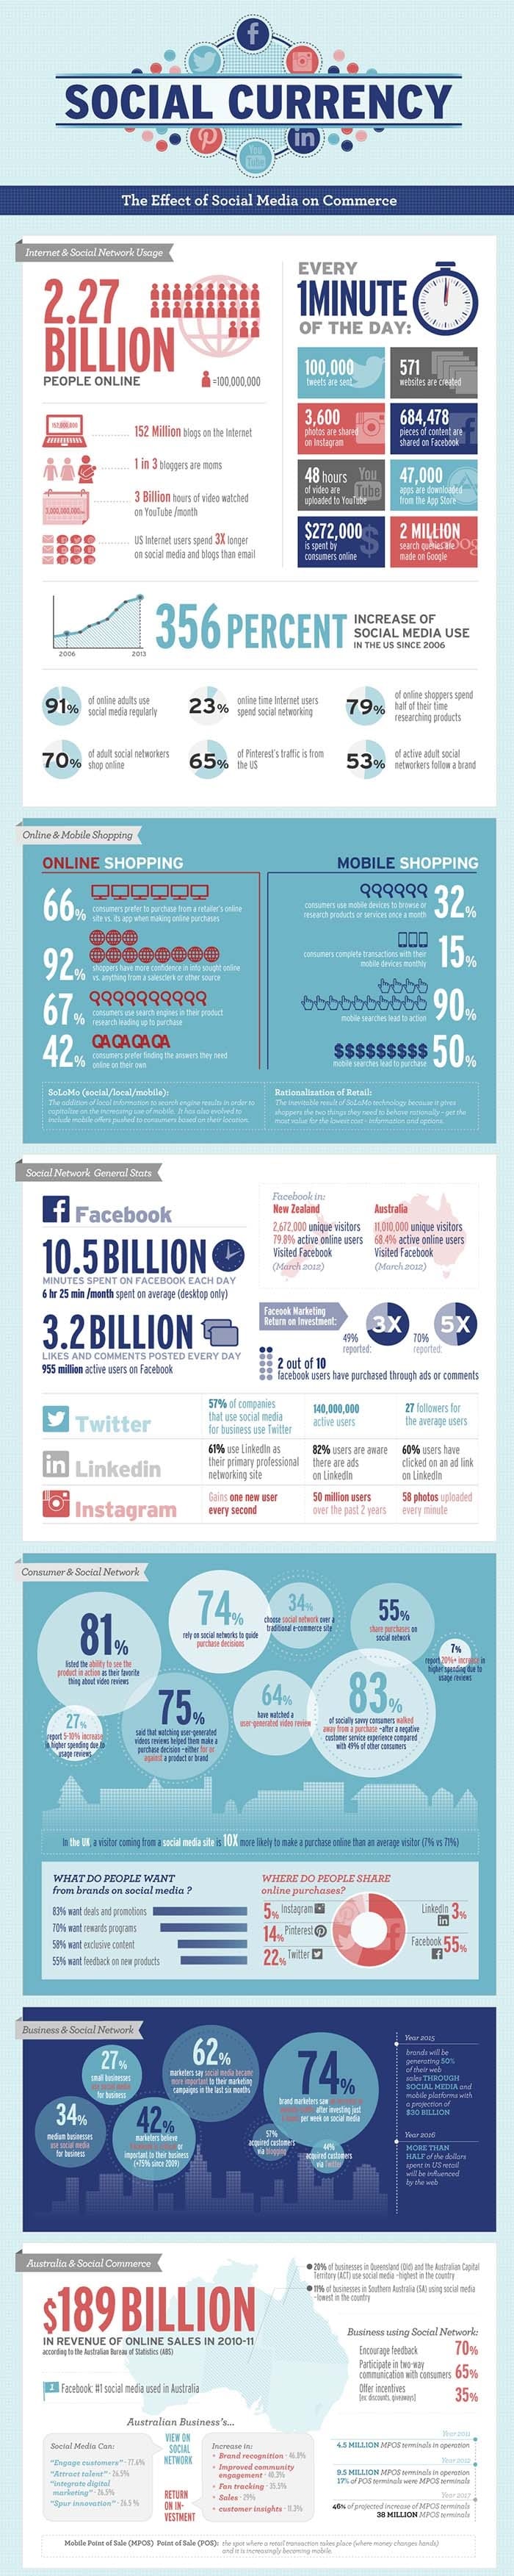
In the meanwhile, fill your noggin with this helpful information that’s offered in this awesome infographic. It gives a detailed assessment of all the most prominent social commerce facts, so you can be in the know from here on out.